The Signal is the System

The Signal is the System

As climate scientists begin to think about ways to catalyze global collective action, they will have to consider evolving their signaling models from analog to digital. From static to dynamic. 

From dead to alive.

Or risk being taken for less-than-serious about their data or the increasingly urgent calls for a mass mobilization to red-alert signals that have no integrated response mechanism except mass panic.

Plato in the metaverse

Plato in the metaverse

At its core, the (m-e-i) Equivalence extends Einstein’s famous principle (E=mc²), positing that just as mass and energy are interchangeable, information is a prime material.

It suggests that information — traditionally viewed as abstract — has physical presence, manifesting mass and influencing the material world as a fundamental building block of the universe. This has profound implications for world-building that harkens back to an ancient theory about the nature of reality.

Planetary Boundaries 4D: Addressing the Anthropocene through generative design (video)

Planetary Boundaries 4D: Addressing the Anthropocene through generative design (video)

The January 2024 PNAS paper from Rockström et al. offers a monumental opportunity for us to upgrade our earth signaling systems. Why? Because the operationalizing of scalar nests is a key feature of any generative data visualization system, which are quantum improvements over the current 2D static models being used to tell stories about human-environmental dynamics.

The mission to build a (live) planetary status signal

Given all our advances in data capture and visualization, it is surprising that the only globally-recognized planetary status signals are 2D, static, and updated annually (with all due respect to the Planetary Boundaries and Doomsday Clock).

So it’s very exciting that there is suddenly movement with scientists and developers to build the prototype for a planetary systems resilience signal and the ORA HALO is front and center as the object being tested for implementation.

The Protostar System as next-gen GIS (Geographic Information System)

For the non geo-nerds out there, GIS is a standard form of terrestrial mapping that was first coined as a term in the mid-1960s, but which dates back decades earlier.

Put simply, GIS is a spatial system that creates, manages, analyzes, and maps all types of data.

Or, more comprehensively:

GIS connects data to a map, integrating location data (where things are) with all types of descriptive information (what things are like there). This provides a foundation for mapping and analysis that is used in science and almost every industry. GIS helps users understand patterns, relationships, and geographic context. The benefits include improved communication and efficiency as well as better management and decision making.

ORA’s Protostar system is essentially a next-generation GIS which takes data from any terrestrial sensor or socio-economic index and terraforms a planetary hologram. This is a generative software which means that algorithms in its creationary engine ‘generate’ patterns and objects that are an embodiment of the data inputs that feed it.

A slide from the Protostar patent - you can view the product brief, here.

While this has vast implications for 3D world-building and metaverses that are responsive to their agents (as opposed to 'canned' or pre-programmed game worlds), the immediate terraforming opportunity for a planetary Protostar is as a 2-Dimensional GIS.

The name for the designs - or patterning conventions - that tell the story about the land and its occupant populations to a viewer in a GIS are called HEATMAPS.

The nerdy definition of a HEATMAP is: a 2-dimensional data visualization technique that represents the magnitude of individual values within a dataset as a color.

A heat map showing the RF coverage of a drone detection system

There are a wide spectrum of design approaches to HEATMAPS and we were fortunate to have one of our colleagues, Lloyd Richards from Interactive Things, undertake a study of the coolest and most relevant patterning styles for our Protostar.

Our vision is that once the system is operationalized as a PaaS, users will be able to access a marketplace of pattern inventories from which to terraform their Protostars. But until then we can just fantasize with Lloyd’s slides:

Generative design is a simulation of quantum field properties

On the mechanical level, ORA’s Protostar system is a coalescence structure that processes data into a generative world hologram - mimicking the way cosmic protostars build from a molecular cloud in space.

Below is the schematic from our patent application, but you can also see the video and product brief, here.

That may be a bit abstract for non-shape rotators out there.

So think of the molecules that coalesce into the molten core of the cosmic protostar as units of data that flow into the digital protostar’s central sphere and are processed into terraforming elements.

Information becomes matter.

With current graphic processing software, this means the data can be converted into a simple red light strobing in the protostar’s central sphere, or that sphere can host detailed terrestrial simulations of climatic or, for example, mass migration events. The protostar can be a crystal ball or a Pandora-like simulation of a fantasy world.

So fundamentally, the protostar is an engine that takes information and converts it into matter (on the digital plane). This is the definition of programmatic design, also known as code art, or, generative art - which is described in this piece.

Put simply, generative designs are coded with algorithms that induct any capturable data inflow (from nature sounds to human biorhythm to unstructured financial market indices) and transform them into patterns, surfaces, and objects.

There’s a reason to stress this point.

It is because the evolution and emergence of generative design represents a signal that we are undergoing a paradigm shift in the fundamental understanding of the nature of reality.

Which is saying a lot, so let’s just unpack it:

What is our general understanding about the nature of reality? At its most basic, and in terms of what the broadest cohort of humanity operate their lives in accordance to, we can say:

It is a materialist-reductionism which posits that the material plane - i.e spacetime - is the primary dimension from which all experiential phenomena are generated; from the atoms in a person’s finger to a political or economic event in reality.

Further: that the best way to understand the material world is to document a reductive study of its components, which can only be viewed through the lens of the agreement that nothing is generated from any other plane than the material.

There are obviously pages that can be written about how this general agreement came to be the dominant world paradigm, but for the sake of brevity, the point is that the materialist-reductionist worldview is critically challenged by development of theories about the nature and features of the quantum field.

Continuous transitions between particle and wave states in both classical and quantum scenarios

It challenges the materialist worldview by offering (the potential) that all atoms, which comprise all matter, are generated from a wave-to-particle conversion that occurs at the transition point between the quantum field and spacetime.

And so… generative design, with its core driver algorithms that ‘bring into being’ visual artifacts of multiple dimensions from flows of data, is a mimic of the generative nature of the quantum field.

If we apply this to one generative object, like the protostar, we can imagine that this immediately offers the constituents of a protostar the simulation of a new level of personal and collective agency in the formation of a world from our core values and behaviors. A kind of superpower that is not available in our agreed-upon materialist-reductive paradigm.

ORA Protostar schematic with generative terraform overlay

Think of it as a parallel layer for wizards, while spacetime remains, affectionately, the domain of muggles.

Product Brief: The Protostar System

A Next-Generation World-Building Technology for Data Visualization and Analysis

ORA is excited to announce we have filed a provisional patent for our generative world-building module, the Protostar System. What follows is the product brief and some slides from our patent application.

Overview
The Protostar System is a generative world-building technology that bio-mimics the way planets are generated in the cosmos. Agnostically, it presents as a three-dimensional data management, navigation, and visualization system that enables users to read and interact with data structured in time and space, offering a groundbreaking approach beyond traditional two-dimensional web pages. The system comprises four distinctive elements that together provide an interactive view of historical, contemporary, and external data, allowing users to understand complex patterns and trends in their ecosystems.

Key Components and Features

  1. Central Core Archive: The core serves as a data archive, employing polyhedron structures to represent specific periods of time or data groupings. It organizes historical data within these structures, which can span months, years, or even decades, providing a comprehensive repository of past events and information.

  2. Data Cloud: Contemporary events in the Protostar are represented as particles, each corresponding to a data point. Events are allocated to layers based on time. The closer an event is to the core, the further back in time it occurred. Event layers are further divided into regions, longitudinal and latitudinal facets which enable users to differentiate and understand context-specific data types . This feature enhances the user's ability to identify patterns and trends in specific areas of interest. Finally, events are further categorized with positive and negative ratings, or charge, visually differentiated through color-coding. This approach provides users with real-time insights into trends that influence the overall health rating of the ecosystem.

  3. Data Halo: The HALO is a stand-alone module that represents an algorithmic-based dynamic light band. It visually aggregates and represents data layers, providing a snapshot of the planet's status at any given moment. Users can program the HALO to display specific data of their choosing, allowing them to focus on areas of interest or concern.

  4. Flock: The Protostar system includes a representation of community or external data in the form of a flock which circumnavigate the protostar. The flock is a user interface that allows access to other Protostars within the network. Orbiting particles serve as direct access points to specific protostars. Visual signals, such as flight patterns, indicate cohesion or disunity in the flock and notify users of changes in the unity or coherence in their network. These also offer an at-a-glance insights into the collective performance of any given group.


Application
ORA has provided a provisional development license to HOAM, a collective that is designing a simulated parallel world to game out new social and economic systems. Their deployment of the Protostar uses this application language:

“The Protostar System is an agnostic world-building tool that allows communities and organizations to seed their theory of change as their world’s source code. As participants engage in actions and deliver outcomes that are aligned with the values of the new world, this data is captured and materialized into a visual representation of that lived experience. The more data that is captured by the Protostar, the more precise the tool becomes in its guidance of player actions toward the construction of their optimal world.”

Overall Utility
The Protostar System revolutionizes data visualization and analysis by offering a three-dimensional representation of data in time and space. By providing historical, contemporary, and external data representations, the system enables users to gain comprehensive insights into complex systemic events. This innovative system has the potential to transform research, decision-making processes and simulating projections of ecosystemic vectors.

The 5Q — Seeing is Believing: Looking at the Next Wave of Healthcare Data Visualization with Stephen Marshall

Neural HALO signaling from MUSE monitor.

Neural HALO signaling from MUSE monitor.

In the 5Q, Tincture sits down with leaders to discuss their day to day work and share their perspectives on healthcare, medicine, and progress.

Stephen Marshall is a technologist and entrepreneur at the forefront of digital media. He’s also a published author, and award-winning film director. As CEO of ORA Systems he is bringing a new kind of real-time, multi-dimensional data visualization to patient care.

1. Can you share an overview of what you’re working on these days? At the highest level, what problem are you trying to solve?

At the highest level, as a company, we’re developing a new visual language to aggregate and communicate multiple big data flows. It is our vision that this volume of complex data will signal in dimensional objects (think clouds, or flowers which are essentially produced by complex data inputs).

In the medical context: we’re developing software that can aid in visually transmitting a patient’s medical narrative — as an intuitive and meaningful experience for physicians, nurses, and the patients themselves — in both momentary (meaning dynamic) and cumulative modules.

So we’re addressing the problem that current modes of structuring and displaying patient data, whether it’s your doctor’s office or in the delivery room, are not optimized for the current technologies, let alone the sheer volume of actionable data, nor for the comprehension and engagement of downstream practitioners and the patients themselves. More specifically, there is a huge opportunity to develop objects that can intuitively and dynamically signal the health of a person.

The first of these developed by our team is called the HALO, a patented visualization that can signal up to 10 distinct data streams (you can play with the SDK, here). We’re working with the H.I.P. Lab at the Mayo Clinic on a few initial applications that will bring it to market for the medical sector.


2. Could you tell us a little bit about your pilot with the Mayo Clinic? In a nutshell, what will you need to demonstrate in order to make this technology available to more patients and doctors?

The new generation of heart rate (HR) wearables pushed the fitness tech sector closer to a medical grade enterprise. With the higher-end devices, users are acquiring a much higher fidelity picture of overall health than the standard Steps-based analytics. But for the average person, without personalized physician interpretation and directives, the HR data is almost meaningless.

With Dr. Bruce Johnson’s H.I.P. lab at Mayo, we’re deploying the HALO to signal data from wearables as a way of educating and engaging users in their overall heart health. Because it’s one thing to watch your steps climb toward the 10K milestone as a metric of performance. It’s way harder to track a recommended HR level, and duration, in order to meet personalized optimal health thresholds.

So we’ve developed the Health HALO as a digital system that allows users to track their daily progress towards optimal heart health by integrating Mayo’s proprietary algorithms in the HALO. Which means each HALO is customized to the user’s own Mayo-prescribed fitness thresholds. The user’s cumulative performance is then tabulated for classification in a four Tier national ranking system of Bronze, Silver, Gold and Elite, also programmed by Mayo Clinic.

The pilot testing for Apple Watch users began in early August and the key here is to gauge user engagement in terms of the readability and intuitiveness of the system as well as changes it brings about in their daily fitness performance. It’s a small group but so far the feedback has been very positive.

Screen Shot 2021-03-31 at 10.45.54 AM.png

Our next step is to integrate a spectrum of wearable devices into the HALO software and release the application for both consumers and as an add-on for wellness platforms. Once we get proven engagement for users, we’ll begin to introduce a dashboard for physicians — the beginning of the next generation EHR — so they can monitor patient stats and, more critically, program HALOs with thresholds determined by stress testing and other factors.

As an aside, we also see a nexus here between patient, physician and insurance companies where we engage payors who might use this technology to reward responsible behavior.


3. Please describe a few of the use cases for real-time patient data visualizations. In general, are these scenarios better suited for short-term, acute episodes?

Real-time visualizations are definitely more suited for short-term episodes. As stand-alone’s they just aren’t designed to architecture cumulative data. The exception here, of course, is the Health HALO, which builds and signals over the course of a 24-hour day. But in the context of overall heart health and fitness, a day is itself a short-term episode.

We’re developing for several use cases, some of which are more sensitive than others. But here are two:

We are currently working on a stress test application with the Johnson lab that creates a HALO from six algorithms (including a patient’s VO2, heart rate recovery, and fitness score across three stress tests). The result is a HALO that gives physicians, nurses, and patients an immediate and intuitive-to-read visualization of their heart health.

The user’s HALO can be normatively compared to optimal HALOs and the user’s previous HALOs. We also coded group HALOs so enterprise and insurers can see distributions of the population on the spectrum.

The other real-time visualization we’re working on is called the Fetal HALO. Current displays used in delivery rooms for fetal tracing data are complex and very difficult for most nurses (and some doctors) to aggregate into a coherent picture of a labor, from initial contractions to birth. The mothers certainly have no idea what the machines are signaling (which, depending on who you talk to, can be considered a good thing.)

And rewinding the data to look at different points during the labor is also difficult.

ORA’s Peter Crnokrak presenting the Fetal HALO in his Visualized Keynote address

ORA’s Peter Crnokrak presenting the Fetal HALO in his Visualized Keynote address

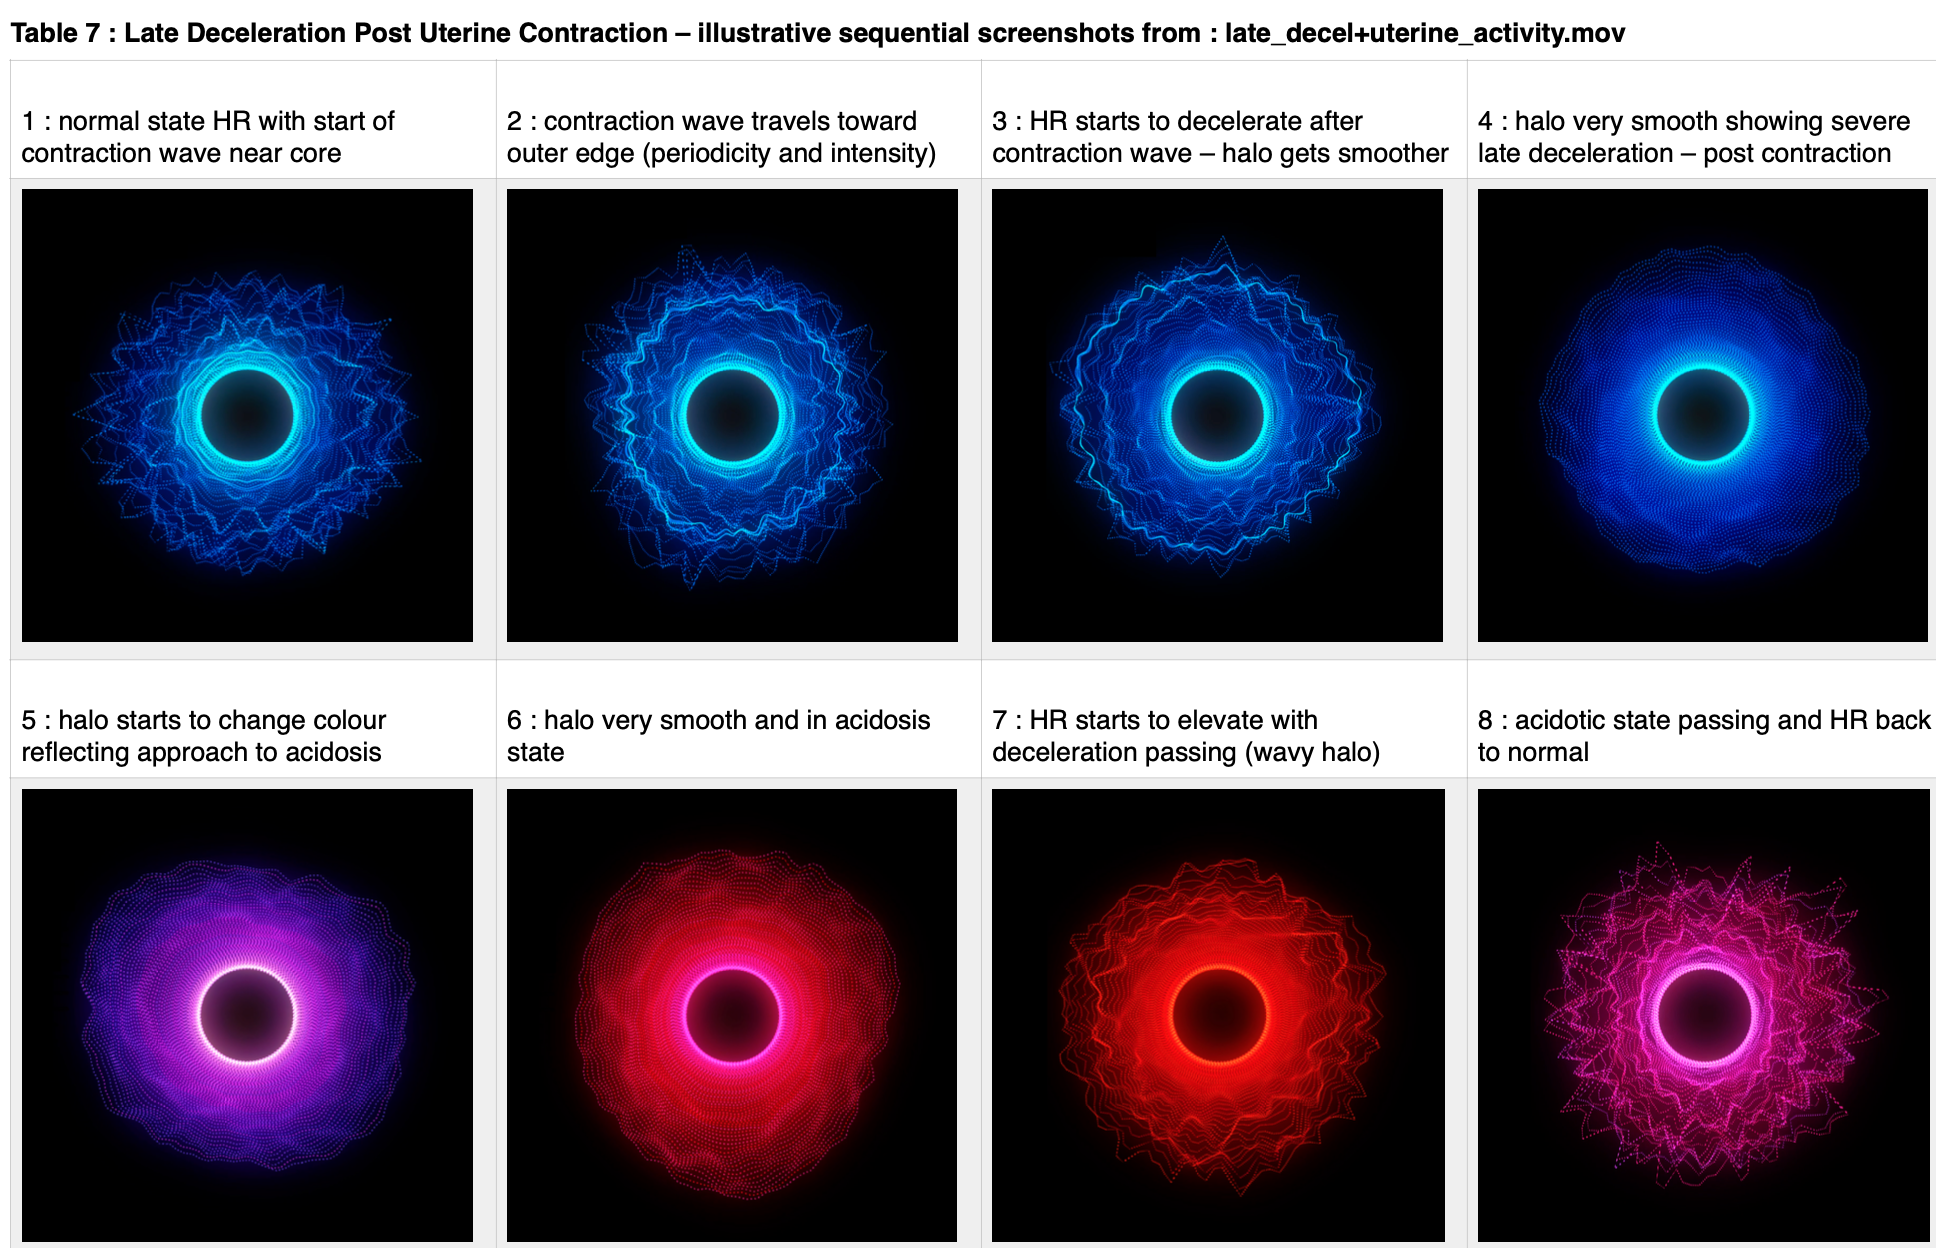
We’ve been working with a leader in the obstetrics field to push fetal data into the HALO. Not only have we matched the color coding used in the fetal charting, as well as integrated the key data flows into an easy-to-read object that a mom-to-be can read, the HALO can even mimic contractions in a way that shows an up-to-the moment picture through transition and delivery.

And the HALO can rewind like a movie of the entire birth for any of the birth team to see. We’re really excited about this one.


4. Can you talk about the origins of the HALO visualization itself? It’s not hard to imagine people getting a plant, or a digital pet, or other gamified visuals. Where do you see this layer of the platform evolving?

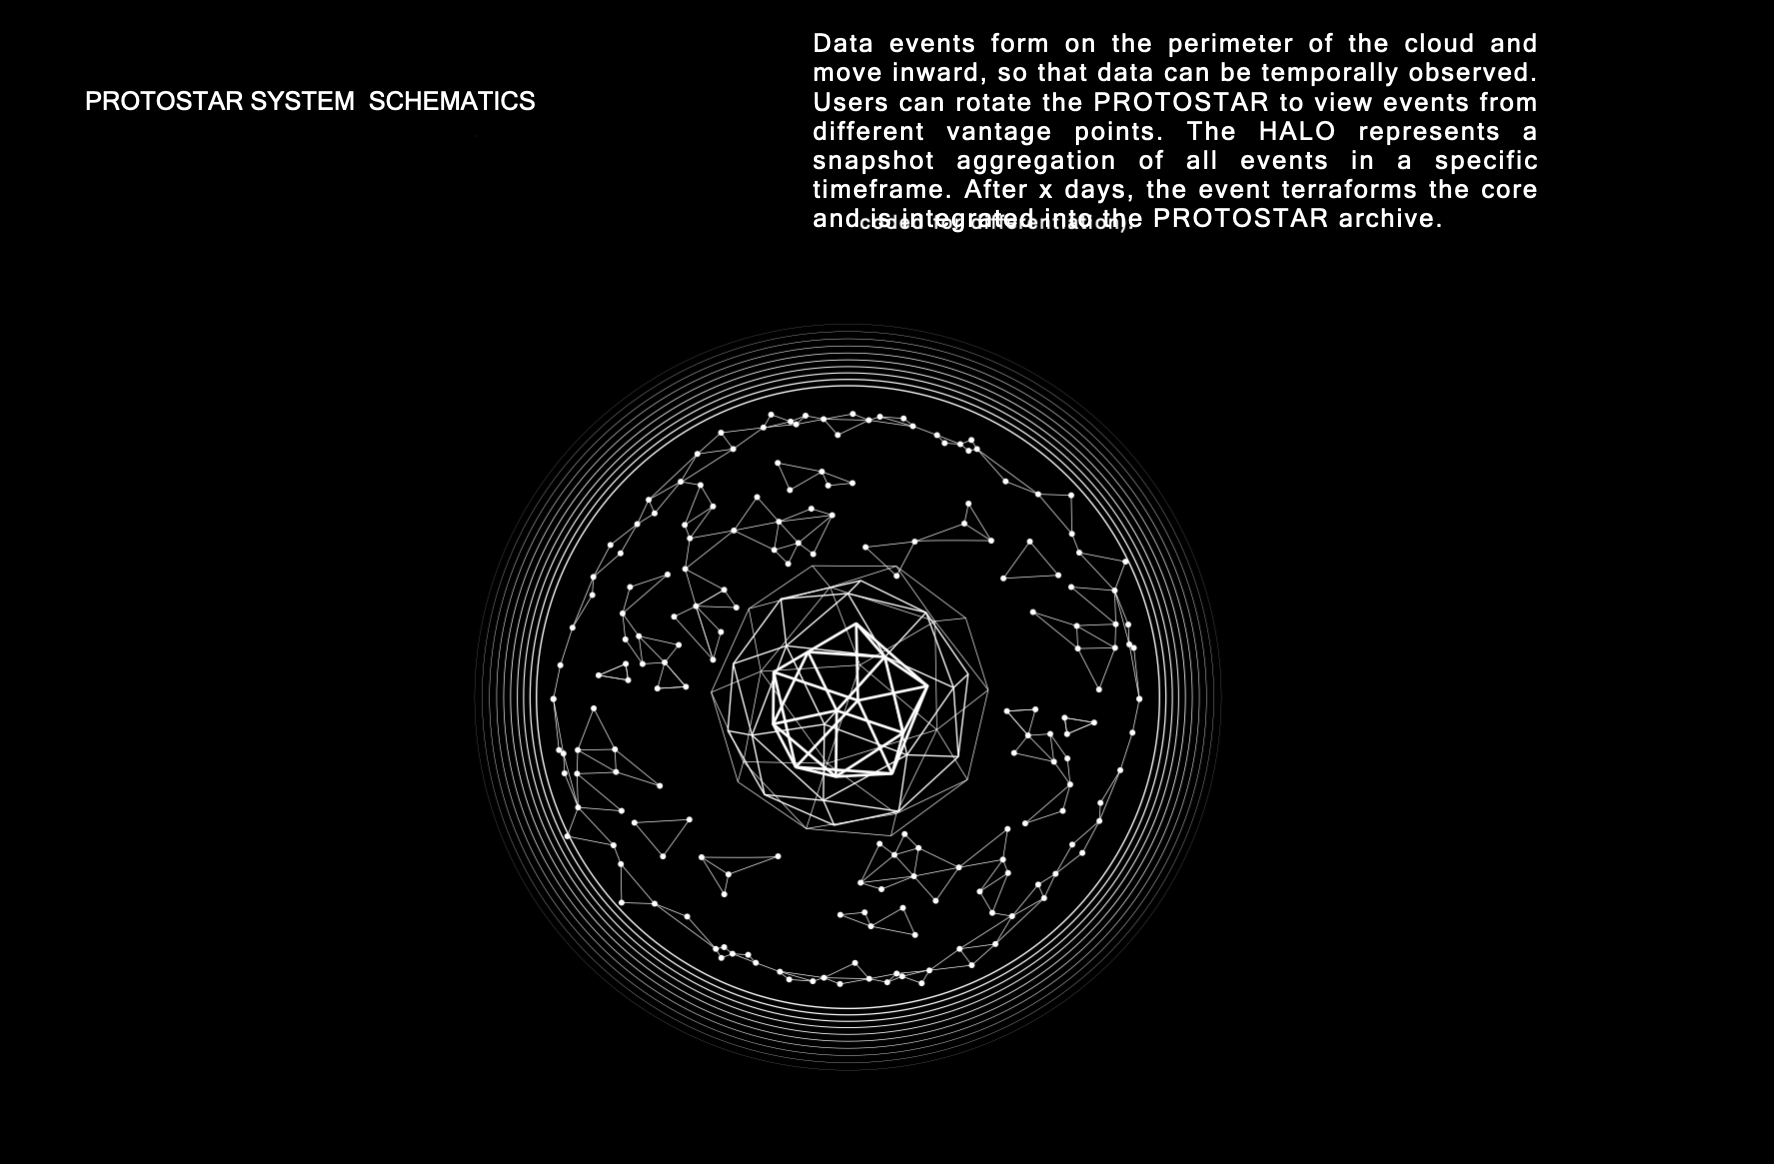
The HALO is part of a larger 3-dimensional, 4-component system called the Protostar, which is still in development.

Without getting too deep into what that is and how it works — it’s safe to say that it’s a self-populating coalescence structure that aggregates and distributes data from the life of a person or entity. Think of it as a 3D ‘browser’ that is navigable and explorable that, if we’re right its application to medical, could become a next generation EHR.

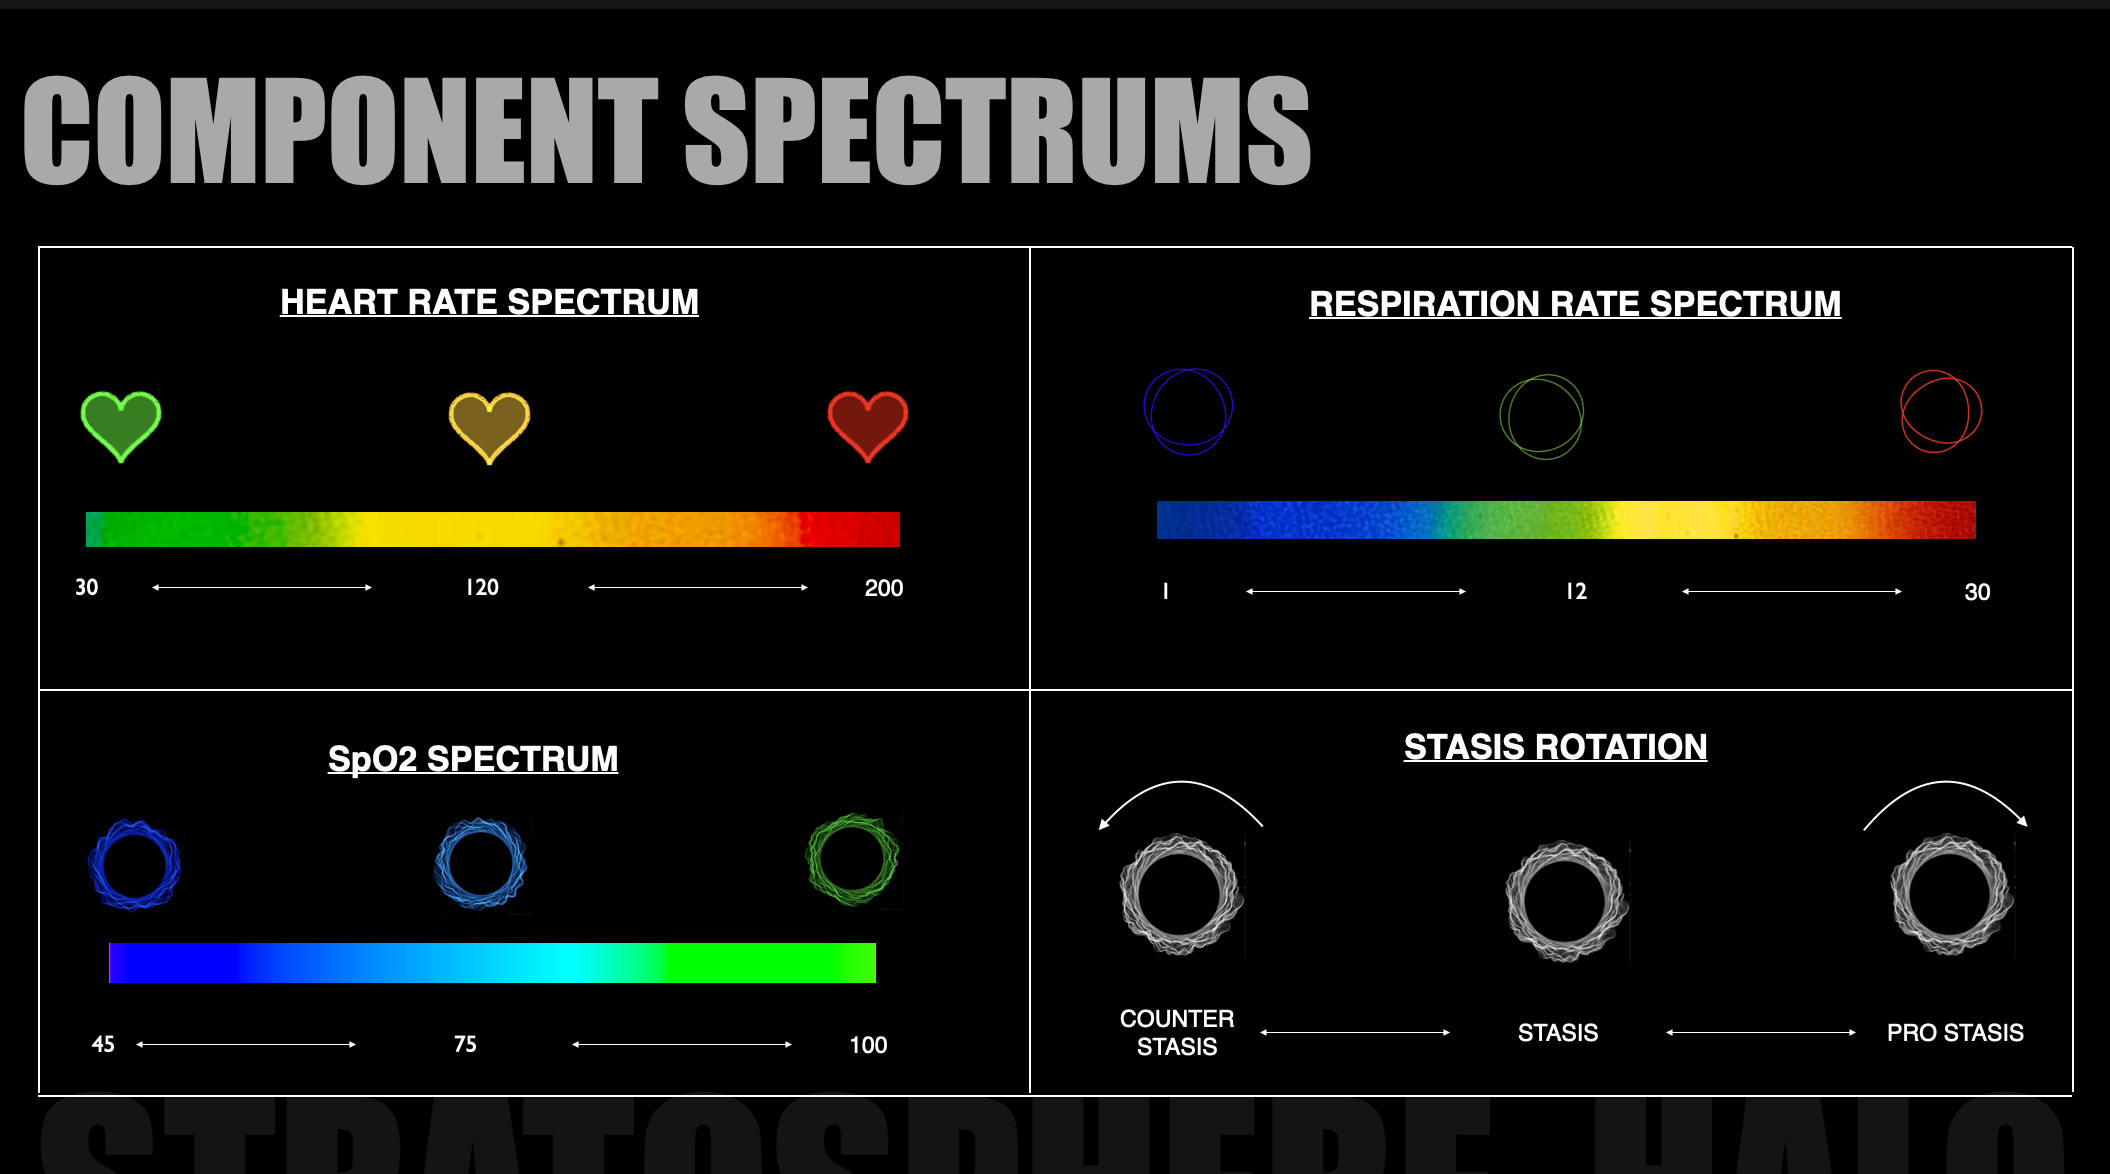
Anyway, the Protostar is obviously a pretty large-scale development initiative. And with the pressure to move our start-up to a viable revenue model, we decided to extract and develop one component of that system as a stand-alone product. That was the piece that signals moment-to-moment health; the HALO.

We actually see a future where social platforms will become object-based. Where the words, pictures, and sounds that comprise a person’s profile will become signaling aspects in objects that are a next-level identity. Beyond the constrictions of DNA, but also algorithmically precise and individualized. Like plants and even worlds.

But that is a crazy BHAG and it’s good to have as a guiding vision. In the near-term, we can imagine a navigable platform of objects that represent an ecosystem of health organizations, their practitioners, and their patients. And a way to start seeing our communities, our geographic regions, and our civilization as a whole in a way that tells us an immediate story about our collective health.

This begins by working out a visual language that can integrate and grow through a progression of data-architected objects. And this necessarily starts with biological signals, and the multitude of applications that that project implies.


5. The healthcare system has shown little interest in improving data visualization for patient engagement. For example, most patient portal lab results are unformatted raw data that are never explained to patients. Practically speaking (culturally, politically, financially), what will it take to leapfrog forward into the modern digital era? Will this sort of thing ever become a standard of care?

I think so. Because we’ve already seen advancements in this regard.

My co-founder Peter Crnokrak says that whenever we significantly decrease the time between a person and their ability to receive, comprehend, and act on data, we mark an evolutionary thrust.

I don’t know what the initial reaction to the development of MRI was, but it would be hard to imagine the forces that would have stood against it, except time and money. And a lack of imagination. Can you imagine any one saying, ‘we have no need for a highly versatile imaging technique that can give us pictures of our anatomy that are better than X-rays?’

That is a prime example of improving data visualization for patient engagement. I know because when my father who was a scratch golfer started missing 2 foot putts, he was able to be diagnosed with neurological cancer. But like the X-ray before it, these are practitioner-side innovations.

The developed world is in the throes of a paradigm shift in medicine. For lots of reasons that I am sure everyone of your readers is deeply familiar with, people are going to have to start learning to take care of themselves. They are going to have to understand this amazing technology called the human body and how it works. And how it lives and why it dies. And to the extent that they take up that challenge, there will be parallel innovations that give them the tools and processes to do that.

Seeing the body and its components in visualizations that not only show their present and historical health, but also guide the user to optimize them will be a demand that technologists and caregivers will meet.

More, we are now moving into a stage — call it population management — in which large medical institutions want to be tracking patients remotely. And there is still a role for humans in that endeavor. By this I mean, we still need people to watch and care for people. In the future this will mean pattern recognition of individuals and their health signals as opposed to an entire health monitoring system being controlled by machine learned thresholds. (Talk about a dystopian nightmare)

And in that scenario, which is already coming fast upon us, would you rather have nurses staring at screens of multiple complex data flows, or objects that can instinctively be read, isolated and acted upon?

I’m going with the latter.

HALO SDK (beta)

ORA's first product is called the HALO. It is dimensional data visualization. Think of it as the new pie chart. 

The HALO is a 3-dimensional object that maps complex data flows into an aggregate, and intuitive, picture that signals the performance of an entity or a person.  This is achieved by writing data calls that populate up to six "vertices" of the HALO (size, color, complexity, speed, brightness, and wobble).

The HALO SDK gives developers access to the ORA API, which generates HALOs from their specified data calls.

If you're a developer who works with big data sets and who wants to get into building dimensional visualizations across multiple vertices, send us an email and we'll get you set up with the HALO SDK (beta version).  

Chasing the Killer App for Wearables

The new generation of heart rate (HR) wearables pushed the fitness tech sector closer to a medical grade enterprise. But for the average person, without personalized physician interpretation and directives, the data is almost meaningless. This presents a huge opportunity for what I believe is the near mythical killer app for wearables. 

It's true that bio-sensors in many of the lower-end wearable devices are sub-par. But if you're willing to spend the $200+ on a Fitbit, Garmin, or Apple Watch, you are acquiring a much higher fidelity picture of overall health than the standard Steps-based analytics.

In fact, there's a pretty common argument (led by the American Heart Association) against the value of a Steps-only fitness metric given that walking is not strenuous. More critically, overall heart health and the prevention of heart disease really depends on the measure of Intensity during exercise, which means habitually pushing your heart rate up to physician-prescribed thresholds for your age, gender, and body type.

And this is where it gets complicated.

It's one thing to watch your steps climb toward the 10K milestone as a metric of performance.  It's way harder to track a recommended HR level, and duration, in order to meet personalized optimal health thresholds

Transmitting the meaningfulness of heart data is a challenge that has been taken up by Dr. Bruce Johnson and his lab team at Mayo Clinic. With over a decade of research in wearables, and a legacy of field work focused on studying the limits of human heart and lung performance, Dr. Johnson has a passion for technology that can meaningfully communicate a person's moment-to-moment fitness in an actionable way.

Here's where the much-maligned Apple Watch actually takes a step above the rest of the wearables field. 

Mayo Clinic is one of many top tier US hospitals that has been trialing the Apple Health Kit (HK) platform that integrates healthcare and fitness apps, allowing them to synchronize via iOS devices and collate their data.  Coupling HK with the Apple Watch's (not-perfect-but) highly rated heart rate sensors, and the paired screen of the iPhone, there was suddenly the opportunity to envision a generative health identity which could show the user exactly where they were in relation to their Mayo-prescribed intensity thresholds, both daily and cumulatively.

Last year, I wrote on LinkedIn about our company's (ORA) vision that in the future, complex and big data flows would signal in dimensional objects (think clouds, or flowers which are essentially produced by complex data inputs). At that time, we were just releasing the beta SDK of our HALO technology. You can see that now-evolved SDK, here.

About 6 months later, we began working with Dr. Johnson and his team to build the first dynamically responsive health identity, called the Health HALO.

Here’s the skinny: ORA and the Mayo Clinic have developed a digital system that allows users to track their daily progress towards optimal heart health by deploying Mayo's proprietary algorithms and embedding them in the Health HALO. The user's cumulative performance is then tabulated for classification in a four Tier national ranking system of Bronze, Silver, Gold and Elite, also programmed by Mayo Clinic. (You can see the performance criteria for the HALO colors and Tiers, here.)

I'm not just the CEO of ORA, I'm also the lead product tester.  And I can say without any exaggeration that this system has totally transformed my approach to fitness and personal health. Where I used to lift weights or hit the stationary bike and hope that I got enough cardio to be considered "healthy", now I engage the HALO app and actively watch it grow with my energy and oxygen, literally, until it blooms into the color-filled HALO that I aspire to. I rarely go to sleep without building a HALO that at least hits what's called a 'rose' level performance:

AAEAAQAAAAAAAAi0AAAAJDBlNjg5MTBmLWM2NjQtNGNmOC1hM2QyLTE4NTU2NTgyNzZhYQ.png


This is the blazing sun I earn after going for a run or crushing the elliptical at the gym:


Our plan after responding to the beta results is to roll out a device agnostic consumer app as well as licensing to wellness platforms.  We also believe there is a huge opportunity here to engage payors who might use this technology to reward responsible behavior. The combination of a bio-dynamic personal health identity that can be pegged to insurance rates, and possibly rebates, is the closest thing to a killer app for wearables I've seen.

But of course I would say that. I'd love to hear what some of you think.

Chasm jumping

crossing-the-chasm.jpg

ORA is developing data systems that will give our customers the ability to store, navigate, and visualize their data.  The first product we designed is a 4-component, 3D module called the protostar system, which is navigable through time and space, and of which the HALO is one component.  

We released and patented the HALO as a way of getting to market faster, and learning from our early adopters about the way users perceive and interact with this new kind of dimensional data viz.

With the imminent release of our (beta) HALO SDK, it marks our move from visionary Innovators  (as introduced by Everett Rogers' diffusion of innovation model), to Early Adopters:

By moving past the visionaries who first engaged us and gave us an outlet and feedback loop to iterate the product, we are now pushing into a SaaS pricing and business model that will involve incrementally larger and more risk-averse customers.

One of the ways this is described in is the 3 Chasm Model, which is a core plank in the business philosophy of Cartezia's Triple Chasm Model

The 3 chasms defined by Cartezia's Triple Chasm Model cover the transition from concept to demonstrator, demonstrator to early product, and early products to volume products. In our experience, most market failures do not occur because of problems with technology, management or funding, but arise from the failure of companies to recognise where they are in this development cycle and understanding the different skills and resources required to cross each chasm.
Crossing Chasm II is about turning the proven concept into a product or service with a viable business model. Historically, this was an area that Venture Capital was supposed to concentrate on, consistent with its mantra of high risk-high return...

Engineering God Mode


Take a sip of this Kool-Aid, and you might be convinced a wave of new technological innovation is upon us:

With  advances in the fields of mobile computing and data processing there is now the potential for a new kind of programming to transform the way human beings identify, exhibit, and explore themselves, and the companies, organizations, and nations they populate.

This is the advent of an evolutionary moment which will be brought on by a new kind of coder/designer. These creative engineers are quietly advancing a new computer language that is best described as object-based, or “generative,” code. And while they are well-known in the tech/design field, Silicon Valley technologists and the investor class are almost universally unaware of them.  

We shouldn’t be surprised.

Like most scientific and technological communities on the verge of paradigm shift, the Valley’s thought and investment leaders have no idea what is coming next. They are too busy trying to benefit from the current status quo, which they have essentially created. And, as Thomas Kuhn noted in his Theory of Scientific Revolutions:

Almost always [those] who achieve these fundamental inventions of a new paradigm have been either very young or very new to the field whose paradigm they change.

And, as we have learned, old paradigms die hard.


| towards a generative code platform |

What is object-based generative code? Put simply, it’s code that dynamically generates and morphs ‘objects’ through a system of inputs which are either controlled by the viewer (directed), or from external sources (passive). So, at its most sophisticated levels, these are programs that animate objects through live data flows; such as bio-signals, stock market indices, sonic beats, language in text messages, weather changes, and geo-locational signals. The people who write this code are described as computational designers, or, as I know them: code artists.

To give you an example of how generative code works: check out the video below, which is a process demo by visionary code artist Reza Ali of a generative app he designed that he describes as “interactive (and) audio-reactive.”

The key here is that the dynamic motion and mutations are responding to live audio signals. This is music + code = free-form object mutation.

Josh Nimoy is another elite computational designer. He was hired by director Joe Kosinski to write code that generated special effects for TRON Legacy (design-directed by my ORA partner GMUNK), considered one of the most stunning achievements in modern GFX. Below is an excerpt of some of the code he wrote for that project:


| tech rev 2.0 |

With advances in the collection, processing, and analysis of data, we have turned a civilizational corner. We can now make sense of a multitudinous system of decisions, and their tethered outcomes, which in the past, were far too complex, and seemingly chaotic, for us to extract any tangible benefit.

That is huge, in evolutionary terms. You can’t truly change anything, either on an individual, institutional, or global level, unless you can ‘objectify’ (or ‘see’) the entity that needs changing. It’s the cornerstone of all healing and personal transformation programs.

It’s called the overview effect. Or, in tech terms, God mode.

But this won’t happen if we limit our work to capitalizing and developing those systems that manipulate and control the data flows to return the most banal, and insidious, behavioral insights.

If we unleash deep data and develop technologies that allow it to signal to us the hidden intelligence in our human, geological, and financial etc. systems, it will bestow a new level of self-awareness and self-knowledge upon our civilization. This means learning to see the hidden messages in the data, instead of writing code that gives us pre-determined outcomes demanded by a myopic, and essentially mercenary, market.

But we also need to develop a set of tools to communicate that intelligence to us. And those will come in the form of generative visualizations: computational objects, environments, and, eventually, worlds, that take complex and seemingly unrelated data flows and aggregate them into “sense-making” technologies.

Evolutionary, paradigm shifting applications that finally free us from the poison pill of human governance that has kept us in the shadow of our true potential. No longer can decisions — political, economic, medical, military, social — be made based on human whims, caprice, biases, or opinions… but, rather, from the nexus of billions of lines of data which can point us to optimal behaviors.

This could revolutionize the way the World Bank lends money. How medicine is priced and distributed in developing world markets. How we develop an accurate and up-to-the-minute reporting mechanism on our survival as a species.

How is it that we are not already making this the most critical objective of our massively endowed technology sector?

Because most of its leaders are stuck in rigid economic systems and ossified ways of seeing.  I know because I spend a lot of time talking to investors and technologists who are rooted in the old paradigm. They cannot not grasp, nor visualize, an infrastructural shift away from text-based computing. They don’t know what generative coding is, how it works, or that there is even the possibility of mapping live data into dynamic objects.

Not surprising, considering the vast amount of capital the major VCs, and the market in general, has invested in text-based social networks and search platforms.


| the next dimension of big data |

Ironically, if Silicon Valley is slow to catch on, the mainstream public is increasingly aware of the kind of future that awaits through generative systems. That’s because the biggest source of funding for these code art projects comes from Hollywood and the motion picture industry. Films like Minority Report, TRON: Legacy, and Prometheus have plot lines that prominently feature generative code-driven holograms and UI/UX interfaces. The design departments for these films, which create functioning tech, are budgeted in the tens of millions of dollars. Yet the technology sector is comparatively underfunded when it comes to engineering a future that is both beautiful and utilitarian.

                                        > Prometheus hologram

                                        > Prometheus hologram

Imagine:

Cities and countries would no longer be depicted solely by their geographic dimensions, but as dimensional objects, formed by all of the data that is flowing out of them. Companies’ online representations would no longer be 2D websites, but rather explorable worlds woven together by the data of the people, performance metrics, and products that they have been built upon. Doctors would no longer have to double as high-level statisticians to read the reams of graphs and numbers that run off their various tech. Instead, they and their patients will view heart and other bodily system status through actionable, bio-mimicked visualizations.

But the killer app, for me, of this evolutionary thrust resides in the social networks and digital identity.

With a new “sky layer” — a data visualization platform which sits atop the social and search realms, powered by generative code — users of Facebook and Twitter would not longer be compartmentalized in some post-Tower of Babel reality in which they are unable to viscerally communicate with anyone outside of their linguistic group.

Instead, they’d experience a dimensional realm, coded in a universal, object-based language in which their ‘profiles’ and identities are based on their biographical and moment-to-moment data.

There is a growing sense that this evolution in computing needs to happen. Human beings must create technologies that harness, alchemize, and output their data so that we can get a view of our world and the impact our moment-to-moment actions have on it.

After all, self-knowledge is the essence of human identity, and the next technological revolution must offer unprecedented opportunities for us to know ourselves, and our world, as we never have.


[Stephen Marshall is the co-founder and product lead for ORA, a Seattle/London-based start-up innovating in the realm of dimensional data visualization, and portfolio company of the DataElite accelerator.]


the future of big data viz

Beautiful articulation of the move to big data biz and object-based computing by Roambi's Quinton Alsbury:

“Data is probably the most intimidating type of content for most end-users outside of analysts to engage with,” says Quinton Alsbury, Co-Founder and President of Product Innovation at Roambi, the winner of the Design for Experience award in Bringing Order to Big Data. “Providing users with a simple and engaging experience that presents the information in an aesthetically pleasant way—and that helps guide them through how they should interpret it via a highly interactive UI—can dramatically improve their confidence. Very often, you find that once this ‘a-ha!’ moment happens for users, they begin clamoring for more and more information.”

“We think of data as content, no different than classic unstructured formats like video, images, copy, etc. Throughout history, different types of content and the mediums used to capture and present it have dominated the culture both in business and in general. We believe that data is quickly becoming the primary content of the 21st century, so there is a huge opportunity to create the tools and the medium to help people interact with it.”  

"I believe there will be a whole new creative class that forms around taking the massive amounts of data that are being generated, and helping transform it into something that is as easy to engage with as video."